Source Code
<div class="dft-card">
  <div class="dft-head">
    <h3>Config diff — v1.4 vs v1.5</h3>
    <div class="dft-legend">
      <span><i class="dft-sw dft-added"></i>Added</span>
      <span><i class="dft-sw dft-removed"></i>Removed</span>
      <span><i class="dft-sw dft-changed"></i>Changed</span>
    </div>
  </div>
  <table class="dft-table">
    <thead><tr><th>Key</th><th>Value</th><th>Owner</th><th>Env</th></tr></thead>
    <tbody id="dftBody"></tbody>
  </table>
</div>*{box-sizing:border-box;margin:0;padding:0}
body{font-family:system-ui,-apple-system,sans-serif;background:#0d1117;color:#e6edf3;min-height:100vh;display:flex;align-items:center;justify-content:center;padding:24px}
.dft-card{background:#161b22;border-radius:14px;padding:18px;width:100%;max-width:620px;border:1px solid #262c36;box-shadow:0 18px 44px rgba(0,0,0,.4)}
.dft-head{display:flex;justify-content:space-between;align-items:center;margin-bottom:12px;flex-wrap:wrap;gap:8px}
.dft-head h3{font-size:14px;font-weight:800}
.dft-legend{display:flex;gap:14px;font-size:11px;color:#8b949e;font-weight:600}
.dft-legend span{display:flex;align-items:center;gap:5px}
.dft-sw{width:10px;height:10px;border-radius:3px;display:inline-block}
.dft-added{background:#2ea043}
.dft-removed{background:#f85149}
.dft-changed{background:#d29922}
.dft-table{width:100%;border-collapse:collapse;font-size:12.5px}
.dft-table th{text-align:left;padding:8px 12px;color:#8b949e;font-weight:700;font-size:11px;text-transform:uppercase;letter-spacing:.03em;border-bottom:1px solid #262c36}
.dft-table td{padding:9px 12px;border-bottom:1px solid #1c2129;color:#c9d1d9;font-family:ui-monospace,SFMono-Regular,Consolas,monospace}
.dft-row-added{background:rgba(46,160,67,.12)}
.dft-row-added td:first-child{border-left:3px solid #2ea043}
.dft-row-removed{background:rgba(248,81,73,.1)}
.dft-row-removed td:first-child{border-left:3px solid #f85149}
.dft-row-removed td{text-decoration:line-through;color:#8b949e}
.dft-row-changed{background:rgba(210,153,34,.1)}
.dft-row-changed td:first-child{border-left:3px solid #d29922}
.dft-cell-changed{position:relative;background:rgba(210,153,34,.22);border-radius:4px}
.dft-old{display:block;font-size:10.5px;color:#8b949e;text-decoration:line-through}
.dft-new{display:block;color:#f0d78c}
.dft-badge{font-size:9.5px;font-weight:800;text-transform:uppercase;letter-spacing:.04em;padding:2px 6px;border-radius:4px;margin-left:8px}
.dft-badge-added{background:#2ea04333;color:#4ade80}
.dft-badge-removed{background:#f8514933;color:#fca5a5}
.dft-badge-changed{background:#d2992233;color:#fbbf24}var BEFORE = [
{ key: 'api.timeout', value: '30s', owner: 'platform', env: 'prod' },
{ key: 'api.retries', value: '3', owner: 'platform', env: 'prod' },
{ key: 'cache.ttl', value: '600s', owner: 'infra', env: 'prod' },
{ key: 'feature.betaSearch', value: 'false', owner: 'search', env: 'staging' },
{ key: 'db.poolSize', value: '20', owner: 'infra', env: 'prod' },
{ key: 'legacy.exportJob', value: 'enabled', owner: 'ops', env: 'prod' },
];
var AFTER = [
{ key: 'api.timeout', value: '45s', owner: 'platform', env: 'prod' },
{ key: 'api.retries', value: '3', owner: 'platform', env: 'prod' },
{ key: 'cache.ttl', value: '600s', owner: 'data', env: 'prod' },
{ key: 'feature.betaSearch', value: 'true', owner: 'search', env: 'staging' },
{ key: 'db.poolSize', value: '20', owner: 'infra', env: 'prod' },
{ key: 'feature.newOnboarding', value: 'true', owner: 'growth', env: 'staging' },
];
// Real row-by-row and cell-by-cell comparison of two datasets keyed by "key".
function diff(before, after) {
var beforeMap = {};
before.forEach(function (r) { beforeMap[r.key] = r; });
var afterMap = {};
after.forEach(function (r) { afterMap[r.key] = r; });
var keys = [];
before.forEach(function (r) { if (keys.indexOf(r.key) === -1) keys.push(r.key); });
after.forEach(function (r) { if (keys.indexOf(r.key) === -1) keys.push(r.key); });
return keys.map(function (key) {
var b = beforeMap[key];
var a = afterMap[key];
if (b && !a) return { key: key, status: 'removed', row: b, changedFields: [] };
if (!b && a) return { key: key, status: 'added', row: a, changedFields: [] };
var changedFields = Object.keys(a).filter(function (field) { return field !== 'key' && a[field] !== b[field]; });
return { key: key, status: changedFields.length ? 'changed' : 'unchanged', row: a, before: b, changedFields: changedFields };
});
}
function fieldCell(entry, field) {
var value = entry.row[field];
if (entry.status === 'changed' && entry.changedFields.indexOf(field) !== -1) {
return '<td class="dft-cell-changed"><span class="dft-old">' + entry.before[field] + '</span><span class="dft-new">' + value + '</span></td>';
}
return '<td>' + value + '</td>';
}
function badge(status) {
if (status === 'unchanged') return '';
var label = status.charAt(0).toUpperCase() + status.slice(1);
return '<span class="dft-badge dft-badge-' + status + '">' + label + '</span>';
}
var results = diff(BEFORE, AFTER);
document.getElementById('dftBody').innerHTML = results.map(function (entry) {
var rowClass = entry.status !== 'unchanged' ? ' dft-row-' + entry.status : '';
return '<tr class="' + rowClass + '">' +
'<td>' + entry.key + badge(entry.status) + '</td>' +
fieldCell(entry, 'value') +
fieldCell(entry, 'owner') +
fieldCell(entry, 'env') +
'</tr>';
}).join('');Learn Coding Visually
Learn to code with interactive, live-preview playgrounds — HTML, CSS, JavaScript, React & more.
 HTML Playground42 lessons · Click-based · Live preview
 CSS PlaygroundLearn CSS with a live editor
 JavaScript Playground60 lessons · DOM · Async · Canvas
 React PlaygroundLearn React with a live code editor
 GSAP PlaygroundLearn GSAP animation interactively
 SVG Playground44 lessons · shapes · paths · animation
 SCSS Playground45 lessons · Sass modules · tokens
 Tailwind PlaygroundLearn Tailwind CSS with a live editor
 Bootstrap 5 Playground50 lessons · live preview
Row-Level Diff Table — Compare Two Datasets HTML CSS JS
Row-Level Diff Table · Tables · Plain HTML, CSS & JS · Live preview
What's included
Features
About this UI Snippet
Row-Level Diff Table — Real Computed Added / Removed / Changed Highlighting
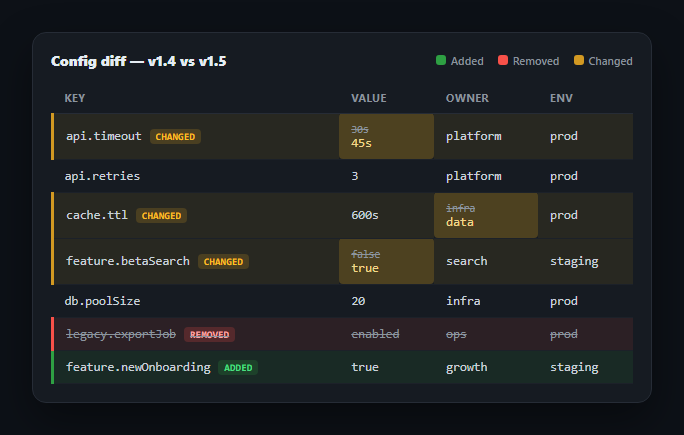
Comparing two versions of a dataset — a config before and after a deploy, a spreadsheet import against the current database, an API response across two environments — is much easier to audit as a single table than as two separate ones. This snippet computes a genuine row-by-row and field-by-field diff between two arrays in plain JavaScript and renders it as one table with added rows in green, removed rows struck through in red, and changed rows in yellow with only the specific cells that actually differ called out.
Keyed comparison, not positional
The diff function builds a lookup map from each dataset keyed by a unique field (key in the demo, but any unique id works), then walks the union of keys present in either version. This is deliberate: comparing row 3 of one array against row 3 of another only works if nothing was reordered, inserted, or removed above it, which is rarely true in practice. Keying by identity means a row that moved position between the two datasets is still correctly matched and compared, not falsely flagged as removed-then-added.
Three real outcomes per key
For every key, the diff falls into exactly one of three buckets computed live: present only in before (removed), present only in after (added), or present in both. For the "present in both" case, Object.keys(a).filter(...) compares every field's value between the two rows and collects which specific fields actually differ — a key with all identical fields is marked unchanged and rendered like a normal row, no highlighting applied.
Cell-level highlighting, not just row-level
A changed row doesn't turn every cell yellow — only the cells whose value actually differs get the dft-cell-changed treatment, showing the old value struck through in small text above the new value in full color. This is what makes the diff genuinely useful: with a row-only highlight you'd know *something* changed but have to hunt for what; the cell-level detail answers that directly, sourced from the changedFields array the comparison function actually computed, not hardcoded per row.
Visual language borrowed from code diffs
The color scheme and left-border accent mirror the added/removed/changed convention from git diffs and code review tools — green for added, red-with-strikethrough for removed, yellow for modified — because that visual vocabulary is already familiar to anyone who reviews changes for a living, making the table legible at a glance without reading the legend.
Fully data-driven, add a row and it just works
Nothing about which rows are added, removed, or changed is precomputed or hand-annotated in the arrays — BEFORE and AFTER are just plain data, and every highlight in the rendered table is the live output of the diff() function running against whatever is currently in those two arrays. Change a value, add a key, remove one, and the table's highlighting updates correctly with no manual bookkeeping.
Customizing it
Swap the identity field, diff nested objects field-by-field recursively, or add a filter to show only changed rows. Pair it with an editable table for the "before" state or a sortable table to reorder the diff results.
Build with AI
Build, Understand, Optimize, and Extend It With AI
Rather than tracing the comparison logic by hand, paste this snippet's HTML, CSS, and JS into an AI coding assistant like Claude and ask it to explain exactly why the diff is built from lookup maps keyed by identity rather than comparing the two arrays by index position, and what specifically would go wrong (false added/removed pairs) if a row were simply reordered between the two datasets under a positional comparison. The same assistant can help you extend it — ask it to add deep comparison for nested object fields, a summary count of how many rows were added/removed/changed, or a toggle to hide unchanged rows so only the meaningful diff is visible. It is also useful for optimization: ask whether building two full lookup maps is worth it for very large datasets versus a single-pass approach. Treat the code less like a finished artifact and more like a starting point for a conversation.
Prompt to recreate it
Copy this into your AI assistant of choice to build the effect from scratch, or as a jumping-off point for your own variant:
Build a "row-level diff table" in plain HTML, CSS, and JavaScript with no library — a table that compares two arrays of row objects (a "before" and "after" version of the same dataset) and highlights what changed.

Requirements:
- Write a pure diff(before, after) function that builds a lookup map from each array keyed by a unique identity field (not by array index), then computes the union of all keys present in either dataset.
- For every key in that union, determine its status by real set membership: present only in before is "removed", present only in after is "added", present in both with at least one differing field is "changed", present in both with all fields identical is "unchanged" — do not hardcode which rows fall into which category.
- For a "changed" row, compute exactly which fields differ (not just that something differs) by comparing each field's value between the before and after versions of that row, and store that list of changed field names.
- Render one table where added rows get a distinct highlight color (e.g. green) with a left-border accent, removed rows get a different highlight color with the entire row's text shown struck through, and changed rows get a third highlight color — but only the specific cells whose field was in the changed-fields list should show a special highlighted treatment (old value struck through in small text, new value in full color below or beside it); untouched cells in a changed row render normally.
- Add a small badge label (Added/Removed/Changed) next to the row's identity value reinforcing its status, and a legend at the top of the table explaining what each color means.
- Make the whole table fully derived from the diff() function's output — editing the before or after source arrays and re-running the diff must update every highlight and badge with no manually maintained highlight state anywhere.
Want to tighten it up first? Run this prompt through the AI Prompt Studio to score it across 8 quality dimensions, catch anti-patterns, and tune the wording for Claude, ChatGPT, or Gemini before you paste it in.
Step by step
How to Use
- 1Paste HTML, CSS, and JSA config diff renders comparing two sample datasets, BEFORE and AFTER.
- 2Read the legendGreen marks added rows, red-strikethrough marks removed rows, yellow marks changed rows.
- 3Inspect a changed rowOnly the specific cells that differ are highlighted, showing the old value struck through above the new one.
- 4Edit BEFORE or AFTERAdd, remove, or change a value in either array — the diff recomputes and the highlighting follows automatically.
- 5Change the identity keySwap 'key' for any unique field in your data — the comparison is keyed, not positional.
- 6Add more fieldsAdd properties to the row objects; changedFields is computed generically over Object.keys, so new fields diff automatically.
Real-world uses
Common Use Cases
Got questions?
Frequently Asked Questions
The diff function marks it status: 'unchanged' since changedFields comes back empty, and the row renders with no highlight class and no badge — it looks like a completely normal row, which is the correct behavior since nothing about it actually changed.
Build a composite key by concatenating multiple fields (e.g. row.category + '|' + row.name) when constructing beforeMap and afterMap, and use that same composite when building the keys union array — the rest of the diff logic is unaffected since it only cares that the key uniquely identifies a row.
Replace the simple a[field] !== b[field] comparison with a deep-equality check (a small recursive function, or JSON.stringify(a[field]) !== JSON.stringify(b[field]) for simple cases) so a field whose value is itself an object or array is correctly detected as changed only when its contents actually differ.
Filter the results array from diff() with results.filter(function(e){ return e.status !== 'unchanged'; }) before mapping it to row HTML — the diff computation itself doesn't need to change, only what you choose to render from its output.
Keep the diff(before, after) function exactly as-is — it's pure JavaScript with no DOM dependency, so wrap it in a useMemo (React), computed (Vue), or getter (Angular) keyed on your before/after data, and map the returned array to row components applying the same status-based classes.