Source Code
<div class="demo">
  <div class="tile">
    <div class="tile-head">
      <h3>Active incidents</h3>
      <span class="count-badge" id="countBadge">2</span>
    </div>

    <div class="incidents" id="incidents"></div>

    <div class="tile-foot">
      <div class="foot-stat">
        <span class="foot-label">Avg time to resolve</span>
        <span class="foot-val" id="mttr">38m</span>
      </div>
      <div class="foot-stat">
        <span class="foot-label">Resolved today</span>
        <span class="foot-val" id="resolvedToday">5</span>
      </div>
    </div>
  </div>
</div>
* { box-sizing: border-box; margin: 0; padding: 0; }
body { font-family: system-ui, sans-serif; background: #f8fafc; display: flex; align-items: center; justify-content: center; min-height: 100vh; padding: 24px; }
.tile { width: 400px; max-width: 100%; background: #fff; border: 1px solid #e2e8f0; border-radius: 16px; padding: 20px 22px; display: flex; flex-direction: column; gap: 14px; }
.tile-head { display: flex; align-items: center; justify-content: space-between; }
.tile-head h3 { font-size: 15px; font-weight: 800; color: #0f172a; }
.count-badge { background: #fee2e2; color: #dc2626; font-size: 12px; font-weight: 800; padding: 3px 10px; border-radius: 999px; }
.count-badge.zero { background: #dcfce7; color: #15803d; }
.incidents { display: flex; flex-direction: column; gap: 8px; }
.inc-row { display: flex; align-items: flex-start; gap: 10px; padding: 11px 12px; border-radius: 11px; background: #f8fafc; border-left: 3px solid #e2e8f0; transition: opacity 0.3s, transform 0.3s; }
.inc-row.sev1 { border-left-color: #dc2626; background: #fef2f2; }
.inc-row.sev2 { border-left-color: #f59e0b; background: #fffbeb; }
.inc-row.sev3 { border-left-color: #6366f1; background: #eef2ff; }
.inc-row.resolving { opacity: 0; transform: translateX(8px); }
.sev-pill { font-size: 9.5px; font-weight: 800; padding: 3px 7px; border-radius: 6px; flex-shrink: 0; margin-top: 1px; white-space: nowrap; }
.sev1 .sev-pill { background: #dc2626; color: #fff; }
.sev2 .sev-pill { background: #f59e0b; color: #fff; }
.sev3 .sev-pill { background: #6366f1; color: #fff; }
.inc-body { flex: 1; min-width: 0; }
.inc-title { font-size: 12.5px; font-weight: 700; color: #0f172a; }
.inc-meta { font-size: 11px; color: #94a3b8; margin-top: 3px; display: flex; gap: 8px; flex-wrap: wrap; }
.inc-meta .dot::before { content: '\2022'; margin-right: 8px; color: #cbd5e1; }
.inc-duration { font-size: 11px; font-weight: 700; color: #64748b; font-variant-numeric: tabular-nums; flex-shrink: 0; }
.empty-state { text-align: center; padding: 22px 10px; color: #94a3b8; font-size: 12.5px; }
.tile-foot { display: flex; gap: 10px; padding-top: 12px; border-top: 1px solid #f1f5f9; }
.foot-stat { flex: 1; display: flex; flex-direction: column; gap: 2px; }
.foot-label { font-size: 10.5px; color: #94a3b8; font-weight: 600; text-transform: uppercase; letter-spacing: 0.03em; }
.foot-val { font-size: 14px; font-weight: 800; color: #0f172a; font-variant-numeric: tabular-nums; }var incidents = [
{ id: 'INC-482', sev: 1, title: 'Payments API returning elevated 5xx errors', service: 'payments-api', startedAt: Date.now() - 14 * 60000 },
{ id: 'INC-481', sev: 2, title: 'Search indexing lag above SLO', service: 'search-indexer', startedAt: Date.now() - 52 * 60000 },
];
var resolvedTodayCount = 5;
var mttrMinutes = 38;
var incEl = document.getElementById('incidents');
var badgeEl = document.getElementById('countBadge');
var resolvedEl = document.getElementById('resolvedToday');
var mttrEl = document.getElementById('mttr');
function formatDuration(ms) {
var mins = Math.floor(ms / 60000);
if (mins < 60) return mins + 'm';
var h = Math.floor(mins / 60);
var m = mins % 60;
return h + 'h ' + m + 'm';
}
function render() {
badgeEl.textContent = incidents.length;
badgeEl.classList.toggle('zero', incidents.length === 0);
if (incidents.length === 0) {
incEl.innerHTML = '<div class="empty-state">No active incidents — all systems operating normally.</div>';
return;
}
incEl.innerHTML = incidents.map(function (inc) {
return '<div class="inc-row sev' + inc.sev + '" data-id="' + inc.id + '">' +
'<span class="sev-pill">SEV' + inc.sev + '</span>' +
'<div class="inc-body">' +
'<div class="inc-title">' + inc.title + '</div>' +
'<div class="inc-meta"><span>' + inc.id + '</span><span class="dot">' + inc.service + '</span></div>' +
'</div>' +
'<span class="inc-duration">' + formatDuration(Date.now() - inc.startedAt) + '</span>' +
'</div>';
}).join('');
}
function tickDurations() {
document.querySelectorAll('.inc-row').forEach(function (row) {
var id = row.dataset.id;
var inc = incidents.find(function (i) { return i.id === id; });
if (!inc) return;
var durEl = row.querySelector('.inc-duration');
if (durEl) durEl.textContent = formatDuration(Date.now() - inc.startedAt);
});
}
function resolveIncident(id) {
var row = incEl.querySelector('[data-id="' + id + '"]');
var inc = incidents.find(function (i) { return i.id === id; });
if (!row || !inc) return;
row.classList.add('resolving');
setTimeout(function () {
incidents = incidents.filter(function (i) { return i.id !== id; });
resolvedTodayCount++;
resolvedEl.textContent = resolvedTodayCount;
var elapsedMin = Math.round((Date.now() - inc.startedAt) / 60000);
mttrMinutes = Math.round((mttrMinutes * (resolvedTodayCount - 1) + elapsedMin) / resolvedTodayCount);
mttrEl.textContent = mttrMinutes + 'm';
render();
}, 300);
}
// Demo: auto-resolve the lowest severity active incident after a few seconds
// to show the empty-state and rolling MTTR update without any real backend.
setTimeout(function () {
if (incidents.length) {
var lowest = incidents.reduce(function (a, b) { return a.sev >= b.sev ? a : b; });
resolveIncident(lowest.id);
}
}, 5000);
render();
setInterval(tickDurations, 1000);Learn Coding Visually
Learn to code with interactive, live-preview playgrounds — HTML, CSS, JavaScript, React & more.
 HTML Playground42 lessons · Click-based · Live preview
 CSS PlaygroundLearn CSS with a live editor
 JavaScript Playground60 lessons · DOM · Async · Canvas
 React PlaygroundLearn React with a live code editor
 GSAP PlaygroundLearn GSAP animation interactively
 SVG Playground44 lessons · shapes · paths · animation
 SCSS Playground45 lessons · Sass modules · tokens
 Tailwind PlaygroundLearn Tailwind CSS with a live editor
 Bootstrap 5 Playground50 lessons · live preview
Incident Status Summary Widget — Free HTML CSS JS Snippet
Incident Status Summary Widget · Dashboards · Plain HTML, CSS & JS · Live preview
What's included
Features
About this UI Snippet
Incident Status Summary Widget — Severity-Ranked List, Live Duration & Rolling MTTR
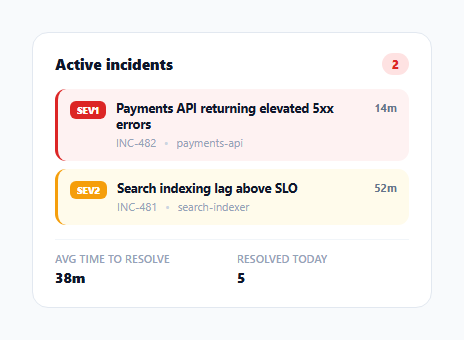
An internal ops dashboard usually has one question that matters more than any other: is anything on fire right now, and how bad? This widget answers it with a severity-ranked list of active incidents, each showing a live elapsed-time counter, plus two rolling statistics — mean time to resolve (MTTR) and incidents resolved today — that update in place as incidents get resolved.
Severity as both a pill and a border color, not just text
Each incident row gets a sev1/sev2/sev3 class that drives both its left border accent color and its background tint, in addition to the SEV1/SEV2/SEV3 pill. Redundant severity encoding (color plus text plus position, since the array is not otherwise sorted) matters here because an incident list is exactly the kind of interface someone scans in a hurry — a single color-blind-unfriendly signal, or text alone requiring careful reading, is worse for a screen someone glances at mid-triage than layered, redundant cues.
A duration that ticks without re-rendering the whole list
tickDurations() runs every second and updates only each row's .inc-duration text node directly via querySelector, rather than calling the full render() function that rebuilds the entire incidents list from scratch. This distinction matters at scale: rebuilding innerHTML every second on a dashboard tile that might sit open for hours is needless DOM churn, and worse, it would interrupt anything mid-interaction (like a hover state) purely to update a timestamp text node.
Resolving is a two-step transition, not an instant removal
resolveIncident() first adds a .resolving class that CSS fades and slides the row out over 300ms, and only *after* that setTimeout delay does it actually splice the incident out of the array and call render(). An incident disappearing from a monitoring dashboard the instant it's marked resolved reads as the list glitching; a brief transition confirms to a watching engineer that the removal was intentional, not an error.
MTTR computed as a running average, not a static number
mttrMinutes is not hardcoded after the initial value — resolveIncident() recomputes it as (mttrMinutes * (resolvedTodayCount - 1) + elapsedMin) / resolvedTodayCount, a running average update that folds the just-resolved incident's actual duration into the existing average without needing to store every individual incident's resolve time. This is the same incremental-average technique used anywhere a rolling statistic needs updating on each new data point without recomputing from a full history array every time.
Build with AI
Build, Understand, Optimize, and Extend It With AI
Paste this snippet's HTML, CSS, and JS into an AI coding assistant like Claude and ask it to explain exactly why tickDurations updates individual text nodes directly instead of calling the full render function every second, and what would visibly break or degrade if it called render() instead on a dashboard tile left open for hours. The same assistant can help optimize it — for instance asking whether the running-average MTTR calculation should be weighted differently for very old incidents versus recent ones. It's also useful for extending the widget: ask it to add a "SEV1 only" filter toggle, sort incidents by severity then by duration, or add a subtle audio or visual alert when a new SEV1 incident is added to the array. Treat the code less like a finished artifact and more like a starting point for a conversation.
Prompt to recreate it
Copy this into your AI assistant of choice to build the effect from scratch, or as a jumping-off point for your own variant:
Build an "active incidents summary" dashboard widget in HTML, CSS, and vanilla JavaScript — no charting or incident-management library.

Requirements:
- Maintain active incidents as an array of plain objects, each with an id, a numeric severity level, a title, an affected service name, and a start timestamp — render one row per incident showing a severity pill, the title, the service name, and a live elapsed-time duration since it started.
- Encode severity redundantly (not just as text) — each row's border accent color and background tint must also change based on severity level, so severity is readable from color alone as well as from the pill text.
- The per-incident duration must tick upward every second, but the update must only touch each row's existing duration text node directly rather than re-rendering the entire incidents list on every tick.
- Implement a "resolve" function that, given an incident's id, first applies a CSS transition class that fades and slides the row out, and only after that transition's duration elapses removes the incident from the underlying array and re-renders the list — resolving must never remove a row from the DOM instantly with no transition.
- Track a running mean-time-to-resolve statistic that updates incrementally on every resolution using only the previous average and the new incident's duration (do not store or replay a full history array to recompute it), plus a separate resolved-today counter that increments on each resolve.
- When the incidents array becomes empty, replace the list with a single calm "no active incidents" message rather than leaving an empty container, and switch any incident-count badge to a visually distinct "all clear" state.
Want to tighten it up first? Run this prompt through the AI Prompt Studio to score it across 8 quality dimensions, catch anti-patterns, and tune the wording for Claude, ChatGPT, or Gemini before you paste it in.
Step by step
How to Use
- 1Watch the live duration countersEach active incident's elapsed time updates every second without re-rendering the rest of the list.
- 2Watch the demo auto-resolveAfter 5 seconds the demo resolves its lowest-severity incident automatically, fading the row out and updating MTTR and the resolved-today count.
- 3Replace the incidents array with real dataPopulate incidents from your incident-management API (PagerDuty, Opsgenie, or an internal system) with the same { id, sev, title, service, startedAt } shape.
- 4Wire resolveIncident to a real eventCall resolveIncident(id) whenever your incident tool reports a resolution via webhook or polling, instead of the demo's setTimeout.
- 5Adjust severity stylingEdit the .sev1/.sev2/.sev3 CSS classes to match your organization's own severity color conventions.
- 6Show an empty state when nothing is activeThe widget automatically renders a calm "no active incidents" message once the incidents array is empty.
Real-world uses
Common Use Cases
Got questions?
Frequently Asked Questions
tickDurations() runs every second but only updates each row's existing .inc-duration text node directly, rather than calling render() and rebuilding the whole incidents list's innerHTML from scratch. This keeps the per-second update cheap even if the incidents list itself is fairly long.
Each row gets a sev1/sev2/sev3 class that simultaneously sets a colored left border, a subtly tinted background, and drives the colored SEV1/SEV2/SEV3 pill text — three redundant visual cues for the same severity level, which matters for a dashboard meant to be scanned quickly under pressure.
resolveIncident() adds a .resolving CSS class that fades and slides the row out over 300ms via a transition, and only removes the incident from the array and re-renders after that delay completes. Removing it instantly would make the list appear to glitch rather than confirming the resolution happened intentionally.
It is a running average, not recomputed from full history each time: mttrMinutes = (mttrMinutes * (resolvedTodayCount - 1) + elapsedMin) / resolvedTodayCount. This folds each newly resolved incident's actual duration into the existing average incrementally.
Replace the static incidents array and the demo's setTimeout auto-resolve with data from your incident tool's API (for example PagerDuty or Opsgenie), keeping the same { id, sev, title, service, startedAt } object shape, and call resolveIncident(id) whenever a webhook or poll reports a real resolution.
render() checks incidents.length and, when zero, replaces the list with a single calm "No active incidents" message and switches the count badge to a green "all clear" style instead of the red active-incident style.