Source Code
<div class="demo">
  <div class="stream-card">
    <div class="stream-header">
      <div>
        <span class="stream-title">Requests / sec</span>
        <span class="stream-value" id="streamValue">—</span>
      </div>
      <button class="stream-pause" id="streamPauseBtn">Pause</button>
    </div>
    <svg class="stream-svg" id="streamSvg" viewBox="0 0 320 100" preserveAspectRatio="none"></svg>
    <p class="stream-note" id="streamNote">Live — updating every 500ms</p>
  </div>
</div>
* { box-sizing: border-box; margin: 0; padding: 0; }
body { font-family: system-ui, sans-serif; background: #f8fafc; display: flex; align-items: center; justify-content: center; min-height: 100vh; padding: 24px; }
.demo { width: 380px; max-width: 100%; }
.stream-card { background: #fff; border: 1px solid #e2e8f0; border-radius: 16px; padding: 18px; display: flex; flex-direction: column; gap: 12px; }
.stream-header { display: flex; align-items: center; justify-content: space-between; }
.stream-title { display: block; font-size: 11.5px; font-weight: 700; color: #94a3b8; text-transform: uppercase; letter-spacing: 0.4px; }
.stream-value { display: block; font-size: 24px; font-weight: 800; color: #111827; font-variant-numeric: tabular-nums; margin-top: 2px; }
.stream-pause { border: 1.5px solid #e2e8f0; background: #fff; color: #475569; font-size: 11px; font-weight: 700; padding: 6px 12px; border-radius: 8px; cursor: pointer; font-family: inherit; }
.stream-pause:hover { border-color: #6366f1; color: #4338ca; }
.stream-pause.paused { background: #fffbeb; border-color: #fbbf24; color: #b45309; }
.stream-svg { width: 100%; height: 100px; display: block; }
.stream-note { font-size: 10.5px; color: #94a3b8; }
.stream-note.paused-note { color: #b45309; }const svg = document.getElementById('streamSvg');
const valueEl = document.getElementById('streamValue');
const pauseBtn = document.getElementById('streamPauseBtn');
const noteEl = document.getElementById('streamNote');
const WINDOW_SIZE = 40; // how many points are visible on the chart at once
const history = Array.from({ length: WINDOW_SIZE }, () => 50);
let paused = false;
let intervalId = null;
// Data continues arriving while paused — this models a real streaming
// source (a WebSocket, a polling interval) that keeps producing values
// regardless of whether the UI is currently rendering them. "Pause" freezes
// the DISPLAY, not the underlying data feed, which is what "live" streaming
// actually means; a version that stopped the data feed itself on pause
// would silently lose real incoming values rather than just not showing them.
let pendingBuffer = [];
function nextValue(last) {
const next = last + (Math.random() - 0.48) * 14;
return Math.max(5, Math.min(180, next));
}
function renderChart() {
const max = Math.max(...history, 60);
const points = history.map((v, i) => {
const x = (i / (WINDOW_SIZE - 1)) * 320;
const y = 92 - (v / max) * 84;
return `${x.toFixed(1)},${y.toFixed(1)}`;
}).join(' ');
const areaPoints = `0,100 ${points} 320,100`;
svg.innerHTML = `
<polygon points="${areaPoints}" fill="rgba(99,102,241,0.08)" />
<polyline points="${points}" fill="none" stroke="#6366f1" stroke-width="2" stroke-linecap="round" stroke-linejoin="round" />
`;
valueEl.textContent = Math.round(history[history.length - 1]).toLocaleString();
}
function tick() {
const last = history[history.length - 1];
const value = nextValue(last);
if (paused) {
// Data still accrues into a buffer while paused — nothing is lost,
// it's simply not yet reflected in the visible chart.
pendingBuffer.push(value);
return;
}
// If we're resuming right after a pause, flush every buffered value that
// arrived while paused, in order, before continuing with new live ticks —
// this is what makes "resume" show a real, complete history rather than
// silently skipping straight from the pre-pause state to just this instant.
if (pendingBuffer.length > 0) {
pendingBuffer.forEach((v) => { history.push(v); history.shift(); });
pendingBuffer = [];
}
history.push(value);
history.shift();
renderChart();
}
pauseBtn.addEventListener('click', () => {
paused = !paused;
pauseBtn.textContent = paused ? 'Resume' : 'Pause';
pauseBtn.classList.toggle('paused', paused);
noteEl.textContent = paused
? `Paused — ${pendingBuffer.length} point${pendingBuffer.length === 1 ? '' : 's'} buffered`
: 'Live — updating every 500ms';
noteEl.classList.toggle('paused-note', paused);
if (paused) return;
// On resume, flush the buffer immediately rather than waiting for the
// next scheduled tick, so the chart catches up right away.
if (pendingBuffer.length > 0) {
pendingBuffer.forEach((v) => { history.push(v); history.shift(); });
pendingBuffer = [];
}
renderChart();
noteEl.textContent = 'Live — updating every 500ms';
});
// Keep the paused note's buffered count updating live too, so pausing for a
// while visibly shows data continuing to accumulate in the background.
setInterval(() => {
if (paused) {
noteEl.textContent = `Paused — ${pendingBuffer.length} point${pendingBuffer.length === 1 ? '' : 's'} buffered`;
}
}, 500);
intervalId = setInterval(tick, 500);
renderChart();Learn Coding Visually
Learn to code with interactive, live-preview playgrounds — HTML, CSS, JavaScript, React & more.
 HTML Playground42 lessons · Click-based · Live preview
 CSS PlaygroundLearn CSS with a live editor
 JavaScript Playground60 lessons · DOM · Async · Canvas
 React PlaygroundLearn React with a live code editor
 GSAP PlaygroundLearn GSAP animation interactively
 SVG Playground44 lessons · shapes · paths · animation
 SCSS Playground45 lessons · Sass modules · tokens
 Tailwind PlaygroundLearn Tailwind CSS with a live editor
 Bootstrap 5 Playground50 lessons · live preview
Real-Time Streaming Metric Chart with Pause/Resume — Data Keeps Flowing While Paused
Real-Time Streaming Metric Chart with Pause/Resume · Charts · Plain HTML, CSS & JS · Live preview
What's included
Features
About this UI Snippet
Streaming Metric Chart — What "Pause" Should Actually Mean
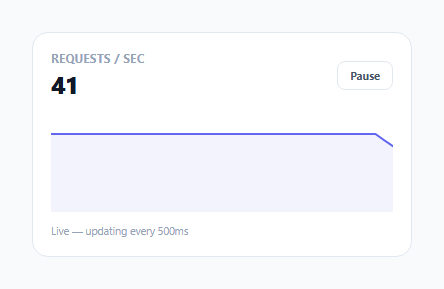
A "pause" button on a live-updating chart is easy to build incorrectly: the naive version simply stops the interval that drives both data collection *and* rendering, which means pausing silently discards every real data point that would have arrived during the pause. This snippet implements the more correct behavior: pausing freezes only the *display*, while the underlying data feed keeps producing values exactly as it would in a real streaming source like a WebSocket or polling connection.
Two separate concerns: data arrival and display rendering
tick() runs on a fixed interval regardless of the paused flag — this models a real streaming data source that has no awareness of, or reason to care about, whatever a UI happens to currently be showing. What *does* change based on paused is what happens with each new value once it arrives: while paused, it's pushed into pendingBuffer and nothing is rendered; while live, it's pushed directly into the visible history window and the chart re-renders immediately.
The buffer preserves real data instead of silently dropping it
Every value that arrives while paused accumulates in pendingBuffer, in arrival order, rather than being discarded. This is the detail that makes the pause behavior genuinely correct rather than merely "looking" correct: a naive pause that literally stops the interval would produce a chart that, on resume, jumps straight from its pre-pause state to whatever the *next* tick happens to be — silently erasing every data point that technically occurred during the pause window, which is a real loss of information for a genuine monitoring or analytics context.
Resuming flushes the buffer in order, immediately
When the pause button is clicked to resume, the code doesn't wait for the next scheduled tick() — it immediately iterates pendingBuffer in its original arrival order, pushing each value into history (and shifting the oldest one out to keep the window size fixed) before re-rendering. This means resuming shows the chart "catching up" to reflect everything that actually happened while paused, all at once, rather than trickling back in one point every 500ms or — worse — simply picking up from whatever the live value happens to be *now*, with no record of what happened in between.
The buffered-count note keeps the pause state honest
While paused, a small note below the chart shows exactly how many data points are currently buffered and waiting, updating live. This is a deliberate transparency detail: it visibly confirms to the user that pausing the *display* is not the same as pausing the underlying *data* — real values are continuing to accumulate in the background the entire time, exactly as they would in the actual system being monitored.
Build with AI
Build, Understand, Optimize, and Extend It With AI
Ask an AI assistant to explain why pausing a live chart's DISPLAY should be architecturally separate from pausing its underlying DATA COLLECTION, and to discuss what real-world streaming sources (WebSockets, polling APIs) this distinction directly models. It's also worth asking for a version that visually marks on the chart exactly where the paused-and-buffered segment begins and ends once flushed, or one that caps the buffer size and gracefully handles what should happen if a pause lasts long enough to overflow it.
Prompt to recreate it
Copy this into your AI assistant of choice to build the effect from scratch, or as a jumping-off point for your own variant:
Build a real-time streaming line chart with a pause/resume control in HTML, CSS, and vanilla JavaScript using inline SVG — no charting library.

Requirements:
- A chart that receives a new simulated data point on a fixed interval (e.g. every 500ms) and redraws an SVG line (with a filled area beneath it) showing a rolling window of the most recent values, along with a large current-value display.
- A Pause/Resume toggle button. Clicking Pause must NOT stop the underlying interval that generates new data points — it must only stop those points from being rendered into the visible chart, since a real streaming data source (a WebSocket, a polling connection) has no awareness of the UI's pause state and would keep delivering data regardless.
- While paused, every newly generated data point must be stored in an ordered buffer rather than discarded, and a visible, live-updating counter must show how many points are currently buffered and waiting.
- Clicking Resume must immediately flush the entire buffer into the chart's visible history, in the exact order the values originally arrived, re-rendering the chart to reflect the true current state right away — not waiting for the next scheduled tick, and not silently jumping to only the very latest value while discarding everything buffered in between.
- Maintain a fixed-size rolling window for the visible chart data (pushing new points on and shifting old ones off) so the chart's time range and Y-axis scale stay consistently bounded regardless of how long the page has been running.
Want to tighten it up first? Run this prompt through the AI Prompt Studio to score it across 8 quality dimensions, catch anti-patterns, and tune the wording for Claude, ChatGPT, or Gemini before you paste it in.
Step by step
How to Use
- 1Watch the chart update liveA new value arrives every 500ms, redrawing the SVG line and area chart and updating the current value display.
- 2Click "Pause"The chart display freezes exactly where it is — but the note below confirms data is still being buffered in the background, with a live count.
- 3Wait a few seconds while pausedThe buffered point count keeps increasing, demonstrating that the underlying data feed never actually stopped.
- 4Click "Resume"Every buffered value flushes into the chart at once, in the order it originally arrived, catching the display up to the true current state immediately.
- 5Replace tick()'s random value generator with a real sourceSwap nextValue() for a real WebSocket message handler or polling fetch, keeping the same pause/buffer/flush structure unchanged.
Real-world uses
Common Use Cases
Got questions?
Frequently Asked Questions
Only the visual rendering stops — the underlying simulated data feed (tick(), driven by its own interval) keeps running exactly as before. Every new value that arrives while paused is pushed into a buffer instead of being rendered, rather than being discarded or never generated at all.
No — every value generated while paused is preserved in pendingBuffer, in the order it arrived. Nothing that occurred during the pause is silently dropped, which is the entire point of this pattern versus a naive implementation that simply stops the interval driving both data and display together.
The buffer is flushed immediately: every buffered value is pushed into the visible history array in its original arrival order (shifting the oldest values out to maintain the fixed window size), and the chart re-renders right away — rather than waiting for the next scheduled tick or jumping straight to only the current live value.
It's a transparency detail confirming to the user that pausing the display is not the same as pausing the actual data source — real values are genuinely still accumulating in the background the whole time, which the live-updating count makes visible rather than leaving as an invisible implementation detail.
That would model an incorrect pause behavior for a genuine streaming data source — a real WebSocket connection or polling interval has no awareness of what the UI happens to be showing and would keep delivering data regardless. Stopping data collection itself on pause would mean losing every value that technically arrived during that window, which this pattern is specifically designed to avoid.
Replace the body of nextValue() (and where it's called inside tick()) with your actual WebSocket onmessage handler or polling fetch response — keep the same paused-buffer-versus-live-render branching structure inside tick() unchanged, since that's the part responsible for the correct pause behavior.