Source Code
<section class="srb-wrap">
  <span class="srb-tag">seller reputation</span>
  <h1>Northgate Camera Co.</h1>

  <div class="srb-summary">
    <span class="srb-avg" id="srbAvg">0.0</span>
    <div class="srb-summary-right">
      <div class="srb-stars" id="srbStars"></div>
      <div class="srb-count" id="srbCount">0 reviews</div>
    </div>
  </div>

  <div class="srb-bars" id="srbBars"></div>
</section>*{box-sizing:border-box;margin:0;padding:0}
body{font-family:system-ui,-apple-system,sans-serif;background:radial-gradient(120% 90% at 50% 0%,#101826,#04070c 60%);color:#fff;min-height:100vh;display:flex;align-items:center;justify-content:center;padding:26px}
.srb-wrap{width:100%;max-width:440px}
.srb-tag{display:inline-block;font-size:10.5px;font-weight:700;letter-spacing:.14em;text-transform:uppercase;color:#93c5fd;background:rgba(147,197,253,.1);border:1px solid rgba(147,197,253,.3);padding:5px 12px;border-radius:99px;margin-bottom:14px}
.srb-wrap h1{font-size:clamp(20px,4.5vw,26px);font-weight:800;letter-spacing:-.02em;margin-bottom:20px}
.srb-summary{display:flex;align-items:center;gap:18px;padding:20px;border-radius:16px;background:#0c1420;border:1px solid rgba(147,197,253,.2);margin-bottom:20px}
.srb-avg{font-size:48px;font-weight:800;color:#facc15;line-height:1}
.srb-summary-right{display:flex;flex-direction:column;gap:4px}
.srb-stars{font-size:18px;letter-spacing:2px;color:#3a4557}
.srb-stars .filled{color:#facc15}
.srb-count{font-size:12.5px;color:#7c93ad}
.srb-bars{display:flex;flex-direction:column;gap:10px}
.srb-row{display:grid;grid-template-columns:36px 1fr 54px;align-items:center;gap:10px;font-size:12.5px;color:#9db3c8}
.srb-row-track{height:9px;border-radius:99px;background:#0c1420;border:1px solid rgba(255,255,255,.06);overflow:hidden}
.srb-row-fill{height:100%;border-radius:99px;background:linear-gradient(90deg,#facc15,#fb923c);width:0%;transition:width .6s ease}
.srb-row-pct{text-align:right;font-variant-numeric:tabular-nums;color:#c7d5e3}var avgEl = document.getElementById('srbAvg');
var starsEl = document.getElementById('srbStars');
var countEl = document.getElementById('srbCount');
var barsEl = document.getElementById('srbBars');
// The underlying dataset: raw counts of reviews at each star level. Every
// number shown in the UI -- the average, the total, and each bar's width --
// is DERIVED from these counts, never hardcoded independently.
var reviewCounts = { 5: 820, 4: 210, 3: 60, 2: 25, 1: 15 };
function computeStats(counts) {
var total = 0;
var weightedSum = 0;
for (var star = 1; star <= 5; star++) {
var c = counts[star] || 0;
total += c;
weightedSum += c * star;
}
var average = total > 0 ? weightedSum / total : 0;
return { total: total, average: average };
}
function renderStars(average) {
starsEl.innerHTML = '';
for (var i = 1; i <= 5; i++) {
var span = document.createElement('span');
span.textContent = '★';
if (i <= Math.round(average)) span.className = 'filled';
starsEl.appendChild(span);
}
}
function renderBars(counts, total) {
barsEl.innerHTML = '';
for (var star = 5; star >= 1; star--) {
var count = counts[star] || 0;
var pct = total > 0 ? (count / total) * 100 : 0;
var row = document.createElement('div');
row.className = 'srb-row';
row.innerHTML =
'<span>' + star + ' ★</span>' +
'<div class="srb-row-track"><div class="srb-row-fill" style="width:' + pct.toFixed(1) + '%"></div></div>' +
'<span class="srb-row-pct">' + pct.toFixed(1) + '%</span>';
barsEl.appendChild(row);
}
}
function render() {
var stats = computeStats(reviewCounts);
avgEl.textContent = stats.average.toFixed(1);
countEl.textContent = stats.total.toLocaleString() + ' review' + (stats.total === 1 ? '' : 's');
renderStars(stats.average);
renderBars(reviewCounts, stats.total);
}
render();Learn Coding Visually
Learn to code with interactive, live-preview playgrounds — HTML, CSS, JavaScript, React & more.
 HTML Playground42 lessons · Click-based · Live preview
 CSS PlaygroundLearn CSS with a live editor
 JavaScript Playground60 lessons · DOM · Async · Canvas
 React PlaygroundLearn React with a live code editor
 GSAP PlaygroundLearn GSAP animation interactively
 SVG Playground44 lessons · shapes · paths · animation
 SCSS Playground45 lessons · Sass modules · tokens
 Tailwind PlaygroundLearn Tailwind CSS with a live editor
 Bootstrap 5 Playground50 lessons · live preview
Seller Rating Breakdown — Free Star Percentage Bar Chart
Seller Rating Breakdown · Charts · Plain HTML, CSS & JS · Live preview
What's included
Features
About this UI Snippet
Seller Rating Breakdown — Percentages Computed, Never Hardcoded
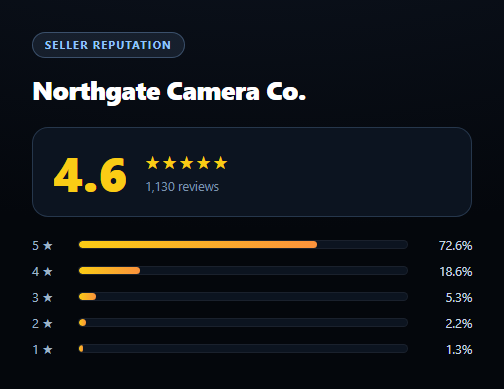
This snippet is the rating summary you see on any marketplace seller or product page — a big average score, a star row, a total review count, and a horizontal bar for each star level showing what share of reviews landed there. What makes it worth reusing is that every number on screen is *derived*, not typed in separately.
One dataset, every number derived from it
The entire component is driven by a single object: reviewCounts = { 5: 820, 4: 210, 3: 60, 2: 25, 1: 15 } — raw counts of how many reviews landed at each star level. computeStats() sums those counts for the total, and computes a weighted average as (5×820 + 4×210 + 3×60 + 2×25 + 1×15) / total. Change any single count in that object and the average, the total, the star-row rounding, and every bar's width and percentage label all update consistently, because none of them are stored independently — they're all recalculated from the same source.
Why that matters
A common shortcut is to hand-write percentage widths per bar (width: 82%, width: 12%...) that happen to look right for one dataset but silently go stale — or never actually summed to 100% in the first place — the moment the underlying numbers change. Here, percentage = count / total * 100 is computed per star level directly from the same counts used for the average, so the bars and the average can never contradict each other.
Rounding for the star row
The top-line star row rounds the average to the nearest whole star (Math.round(average)) purely for the filled/unfilled glyph display — the *numeric* average shown beside it (4.6) keeps full precision, so the visual shorthand never overstates what the exact number says.
Reusable with any dataset
Swap in your own reviewCounts object — pulled from an API response, a CMS field, or computed server-side — and every part of the UI recalculates correctly with no other code changes needed. Pair this with a rating breakdown or star rating input for a full reviews section, or a review form to collect the underlying data this component visualizes.
Build with AI
Build, Understand, Optimize, and Extend It With AI
Paste this snippet's HTML, CSS, and JS into an AI coding assistant like Claude and ask it to explain why deriving the average and every bar's percentage from the same reviewCounts object guarantees they can never contradict each other, versus a version that hardcodes an average number and bar widths separately. It's also useful for reasoning about the star-rounding decision — ask why the numeric average keeps full precision while the star icon row rounds to the nearest whole star, and what UX problem that avoids. For extensions, ask it to add a filter that re-renders the review list below the summary when a specific star-level bar is clicked, or to animate the average number counting up from 0 on load. Treat the code less like a finished artifact and more like a starting point for a conversation.
Prompt to recreate it
Copy this into your AI assistant of choice to build the effect from scratch, or as a jumping-off point for your own variant:
Build a "seller rating breakdown" summary in plain HTML, CSS, and JavaScript — no libraries.

Requirements:
- A single JS data object reviewCounts = { 5: <count>, 4: <count>, 3: <count>, 2: <count>, 1: <count> } representing raw review counts per star level (use realistic sample numbers like 820/210/60/25/15).
- CRITICAL: compute the overall average rating as a count-weighted mean directly from reviewCounts (sum of count × star level, divided by total review count) — do not hardcode the average as a separate number.
- CRITICAL: for each of the 5 star levels, render a horizontal bar whose width AND percentage label are both computed live as (countForThatLevel / totalReviews) * 100 — do not hardcode any bar's width or percentage.
- Display the computed average prominently (one decimal place), a 5-star icon row where whole stars are filled up to Math.round(average) while the numeric average text keeps full precision, and the total review count formatted with locale thousands separators.
- Bars should render 5-star at the top down to 1-star at the bottom, each showing the star level, a track/fill bar, and the percentage.
- Keep the calculation logic (computeStats or similar) as a pure function separate from the DOM-rendering code, so it's easy to port to a component framework.
Want to tighten it up first? Run this prompt through the AI Prompt Studio to score it across 8 quality dimensions, catch anti-patterns, and tune the wording for Claude, ChatGPT, or Gemini before you paste it in.
Step by step
How to Use
- 1Paste HTML, CSS, and JSThe summary renders from the sample reviewCounts data.
- 2Check the averageComputed as a count-weighted mean, not typed in directly.
- 3Check each barWidth and percentage both equal count / total × 100.
- 4Edit reviewCountsChange any star's count and every number updates together.
- 5Confirm bars sum to 100%Because they share one source of truth, they always will.
- 6Swap in real API dataReplace the object with a fetched review-count response.
Real-world uses
Common Use Cases
Got questions?
Frequently Asked Questions
It's a count-weighted mean over the raw reviewCounts dataset: each star level's count is multiplied by its star value, those products are summed, and the total is divided by the overall review count — (5×countFor5 + 4×countFor4 + ... ) / totalReviews. It is never a separately hardcoded number, so it always matches whatever the underlying counts say.
Each star level's bar width and label both come from the same formula: percentage = (countForThatStar / totalReviews) * 100, computed live from the reviewCounts object in renderBars(). Because every bar uses the same total, the five percentages will always sum to 100% (aside from floating-point display rounding).
Individual star glyphs can only be visually filled or unfilled — there's no meaningful way to render "4.6 out of 5 stars" as partial icons in this simple version — so Math.round(average) picks the nearest whole number purely for that display. The numeric average text next to it keeps full one-decimal precision, so the visual shorthand never misrepresents the exact figure.
Yes — generalize the loop bounds in computeStats(), renderStars(), and renderBars() from a fixed 1-5 range to however many levels your scale uses, and adjust the reviewCounts keys to match. The weighted-average and percentage formulas themselves don't assume a 5-star scale specifically.
Move reviewCounts into a prop or fetched state value, call the same computeStats() logic (kept as a pure function) inside a derived/computed value, and map over the five star levels to render bar rows from JSX/template syntax instead of innerHTML. The math is entirely framework-agnostic.